Menu Images
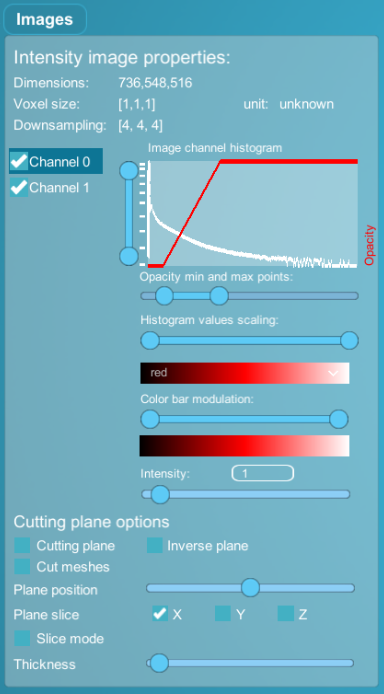
This menu allows to display/hide intensity images on a dataset, as well as modifying the visualization parameters.
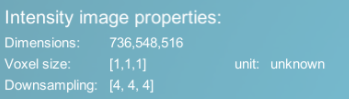 |
Image properties |
|---|---|
| Dimensions | Original image dimensions in x,y,z axes |
| Voxel size | Original image dimensions in x,y,z axes |
| Unit | Voxel size unit (not implemented yet, will always show unknown) |
| Downsampling | Downsampling applied to each axis (x,y and z) of the image |
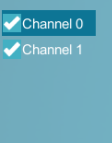 |
Select channels and toggle visibiliy on/off |
|---|---|
| Select channel | Click on the channel name to select it and change parameters with the interface. |
| Toggle visibility | click on the checkbox to toggle channel visibility. (toggling all the channels off can result in high performance increase in case of low framerate) |
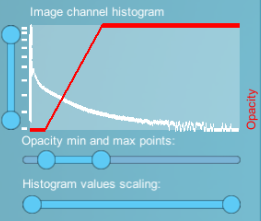 |
Image histogram and thresholding/opacity parameters (for currently selected channel). |
|---|---|
| Histogram | Image histogram (y-axis is non-linear) |
| Red opacity curve | The red curve on the histogram is the opacity curve. it is manipulated by the two double-sliders (horizontal and vertical axis). the vertical axis is the opacity value, and the horizontal axis is the voxel value in the image. MorphoNet tries to find optimal values by default with an Otsu threshold. essentially, manipulating the horizontal sliders allows you to threshold values out of the image rendering and manipulating the vertical sliders allow you to change the opacity of the rendering. |
| Histogram values scaling | This double slider allows you to threshold values out of the histogram by chaning the upper and lower bounds. This option can be useful for very precise thresholding. |
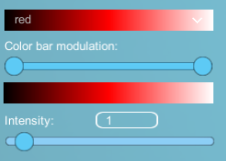 |
Color map parameters (for currently selected channel) |
|---|---|
| Color bar selection | Select the color bar on which the current channel will be rendered. |
| Color bar modulation | Modify the upper/lower value of the color bar with the double slider to achieve different visual results. |
| Preview | The last rectangle allows you to preview in which colors the current channel will be rendered. |
| intensity | Allows you to apply a multiplier to image value. can be of some use with very low intensity images. |
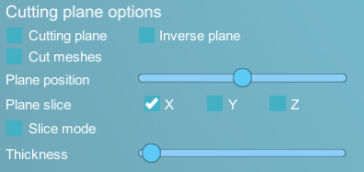 |
Cutting plane options (for whole intensity image) |
|---|---|
| Cutting plane checkbox | Toggle on/off the cutting plane option. |
| Inverse plane checkbox | Invert the side of the cutting plane. |
| Cut meshes checkbox | Cut meshes as well as the intensity image. |
| Position slider | Control the position of the cutting plane along the current axis. |
| Plane slice checkboxes | Select the axis of the cutting plane. |
| Slice mode checkbox | Activate slice mode (only a slice of the image will be shown). |
| Thickness slider | change the thickness of the slice mode. |